深浅模式
绘图
一、本文介绍
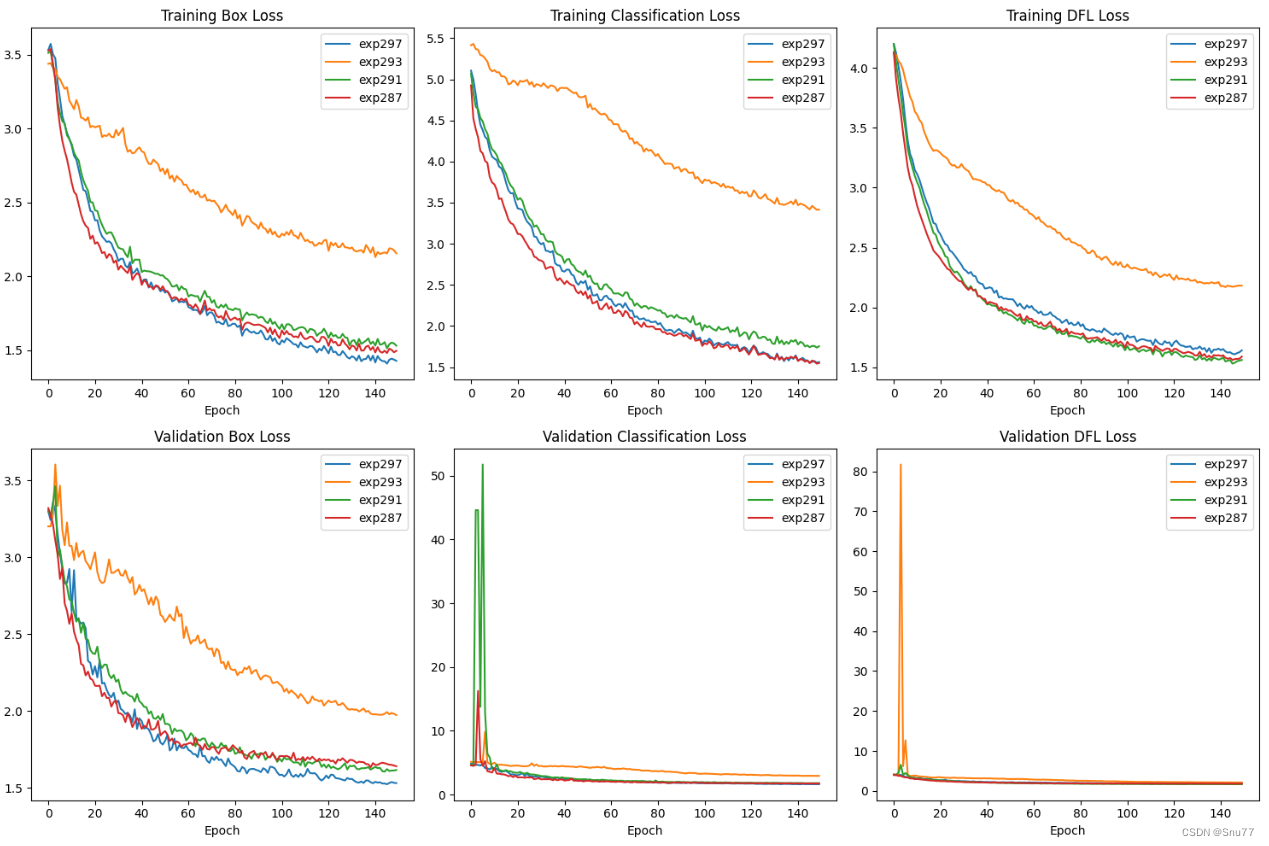
本文给大家带来的是YOLOv8系列的绘图功能,我将向大家介绍YOLO系列的绘图功能。我们在进行实验时,经常需要比较多个结果,针对这一问题,我写了点代码来解决这个问题,它可以根据训练结果绘制损失(loss)和mAP(平均精度均值)的对比图。这个工具不仅支持多个文件的对比分析,还允许大家在现有代码的基础上进行修,从而达到数据可视化的功能,大家也可以将对比图来放在论文中进行对比也是非常不错的选择。
先展示一下效果图->
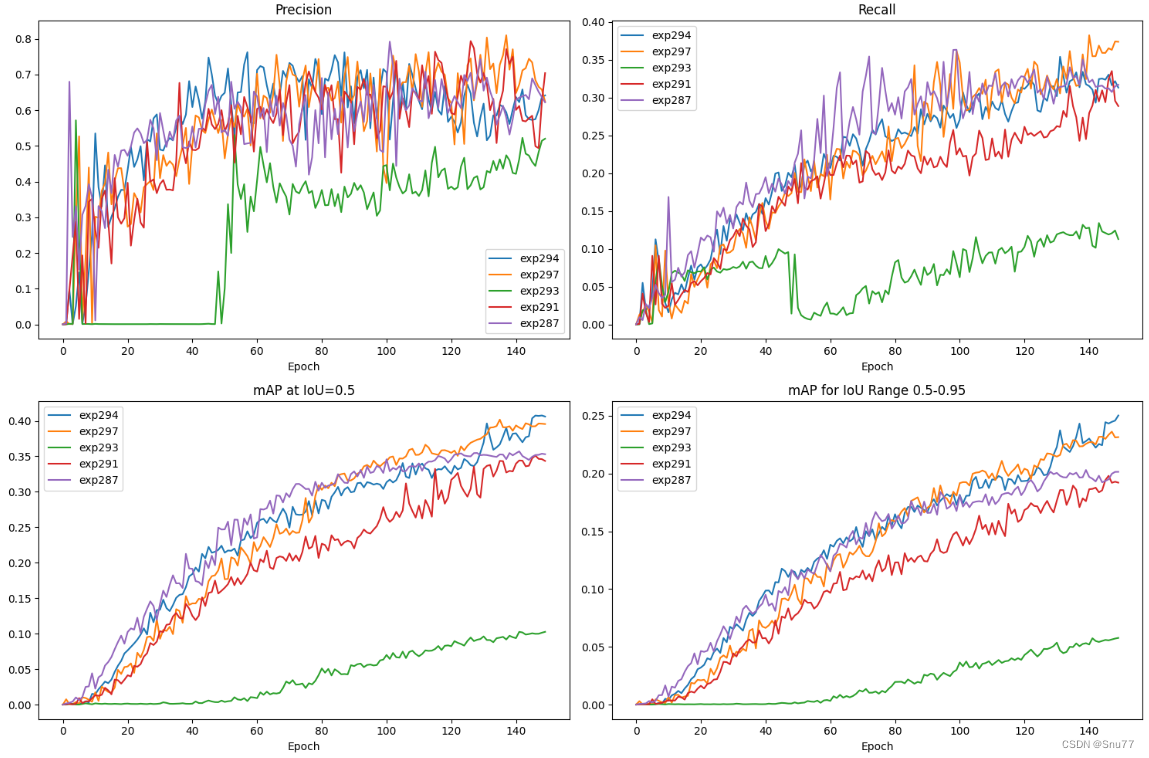
损失对比图象->
二、绘图工具核心代码
python
import os
import pandas as pd
import matplotlib.pyplot as plt


def plot_metrics_and_loss(experiment_names, metrics_info, loss_info, metrics_subplot_layout, loss_subplot_layout,
                          metrics_figure_size=(15, 10), loss_figure_size=(15, 10), base_directory='runs/train'):
    # Plot metrics
    plt.figure(figsize=metrics_figure_size)
    for i, (metric_name, title) in enumerate(metrics_info):
        plt.subplot(*metrics_subplot_layout, i + 1)
        for name in experiment_names:
            file_path = os.path.join(base_directory, name, 'results.csv')
            data = pd.read_csv(file_path)
            column_name = [col for col in data.columns if col.strip() == metric_name][0]
            plt.plot(data[column_name], label=name)
        plt.xlabel('Epoch')
        plt.title(title)
        plt.legend()
    plt.tight_layout()
    metrics_filename = 'metrics_curves.png'
    plt.savefig(metrics_filename)
    plt.show()

    # Plot loss
    plt.figure(figsize=loss_figure_size)
    for i, (loss_name, title) in enumerate(loss_info):
        plt.subplot(*loss_subplot_layout, i + 1)
        for name in experiment_names:
            file_path = os.path.join(base_directory, name, 'results.csv')
            data = pd.read_csv(file_path)
            column_name = [col for col in data.columns if col.strip() == loss_name][0]
            plt.plot(data[column_name], label=name)
        plt.xlabel('Epoch')
        plt.title(title)
        plt.legend()
    plt.tight_layout()
    loss_filename = 'loss_curves.png'
    plt.savefig(loss_filename)
    plt.show()

    return metrics_filename, loss_filename


# Metrics to plot
metrics_info = [
    ('metrics/precision(B)', 'Precision'),
    ('metrics/recall(B)', 'Recall'),
    ('metrics/mAP50(B)', 'mAP at IoU=0.5'),
    ('metrics/mAP50-95(B)', 'mAP for IoU Range 0.5-0.95')
]

# Loss to plot
loss_info = [
    ('train/box_loss', 'Training Box Loss'),
    ('train/cls_loss', 'Training Classification Loss'),
    ('train/dfl_loss', 'Training DFL Loss'),
    ('val/box_loss', 'Validation Box Loss'),
    ('val/cls_loss', 'Validation Classification Loss'),
    ('val/dfl_loss', 'Validation DFL Loss')
]

# Plot the metrics and loss from multiple experiments
metrics_filename, loss_filename = plot_metrics_and_loss(
    experiment_names=['exp294', 'exp297', 'exp293', 'exp291', 'exp287'],
    metrics_info=metrics_info,
    loss_info=loss_info,
    metrics_subplot_layout=(2, 2),
    loss_subplot_layout=(2, 3)
)三、使用讲解
使用方式非常简单,我们首先创建一个文件,将核心代码粘贴进去,其中experiment_names这个参数就代表我们的每个训练结果的名字, 我们只需要修改这个即可,我这里就是五个结果进行对比,修改完成之后大家运行该文件即可。
五、热力图代码
使用方式我会单独更一篇,这个热力图代码的进阶版,这里只是先放一下。
python
import warnings
warnings.filterwarnings('ignore')
warnings.simplefilter('ignore')
import torch, yaml, cv2, os, shutil
import numpy as np
np.random.seed(0)
import matplotlib.pyplot as plt
from tqdm import trange
from PIL import Image
from ultralytics.nn.tasks import DetectionModel as Model
from ultralytics.utils.torch_utils import intersect_dicts
from ultralytics.utils.ops import xywh2xyxy
from pytorch_grad_cam import GradCAMPlusPlus, GradCAM, XGradCAM
from pytorch_grad_cam.utils.image import show_cam_on_image
from pytorch_grad_cam.activations_and_gradients import ActivationsAndGradients

def letterbox(im, new_shape=(640, 640), color=(114, 114, 114), auto=True, scaleFill=False, scaleup=True, stride=32):
    # Resize and pad image while meeting stride-multiple constraints
    shape = im.shape[:2]  # current shape [height, width]
    if isinstance(new_shape, int):
        new_shape = (new_shape, new_shape)

    # Scale ratio (new / old)
    r = min(new_shape[0] / shape[0], new_shape[1] / shape[1])
    if not scaleup:  # only scale down, do not scale up (for better val mAP)
        r = min(r, 1.0)

    # Compute padding
    ratio = r, r  # width, height ratios
    new_unpad = int(round(shape[1] * r)), int(round(shape[0] * r))
    dw, dh = new_shape[1] - new_unpad[0], new_shape[0] - new_unpad[1]  # wh padding
    if auto:  # minimum rectangle
        dw, dh = np.mod(dw, stride), np.mod(dh, stride)  # wh padding
    elif scaleFill:  # stretch
        dw, dh = 0.0, 0.0
        new_unpad = (new_shape[1], new_shape[0])
        ratio = new_shape[1] / shape[1], new_shape[0] / shape[0]  # width, height ratios

    dw /= 2  # divide padding into 2 sides
    dh /= 2

    if shape[::-1] != new_unpad:  # resize
        im = cv2.resize(im, new_unpad, interpolation=cv2.INTER_LINEAR)
    top, bottom = int(round(dh - 0.1)), int(round(dh + 0.1))
    left, right = int(round(dw - 0.1)), int(round(dw + 0.1))
    im = cv2.copyMakeBorder(im, top, bottom, left, right, cv2.BORDER_CONSTANT, value=color)  # add border
    return im, ratio, (dw, dh)

class yolov8_heatmap:
    def __init__(self, weight, cfg, device, method, layer, backward_type, conf_threshold, ratio):
        device = torch.device(device)
        ckpt = torch.load(weight)
        model_names = ckpt['model'].names
        csd = ckpt['model'].float().state_dict()  # checkpoint state_dict as FP32
        model = Model(cfg, ch=3, nc=len(model_names)).to(device)
        csd = intersect_dicts(csd, model.state_dict(), exclude=['anchor'])  # intersect
        model.load_state_dict(csd, strict=False)  # load
        model.eval()
        print(f'Transferred {len(csd)}/{len(model.state_dict())} items')

        target_layers = [eval(layer)]
        method = eval(method)

        colors = np.random.uniform(0, 255, size=(len(model_names), 3)).astype(np.int)
        self.__dict__.update(locals())

    def post_process(self, result):
        logits_ = result[:, 4:]
        boxes_ = result[:, :4]
        sorted, indices = torch.sort(logits_.max(1)[0], descending=True)
        return torch.transpose(logits_[0], dim0=0, dim1=1)[indices[0]], torch.transpose(boxes_[0], dim0=0, dim1=1)[indices[0]], xywh2xyxy(torch.transpose(boxes_[0], dim0=0, dim1=1)[indices[0]]).cpu().detach().numpy()

    def draw_detections(self, box, color, name, img):
        xmin, ymin, xmax, ymax = list(map(int, list(box)))
        cv2.rectangle(img, (xmin, ymin), (xmax, ymax), tuple(int(x) for x in color), 2)
        cv2.putText(img, str(name), (xmin, ymin - 5), cv2.FONT_HERSHEY_SIMPLEX, 0.8, tuple(int(x) for x in color), 2, lineType=cv2.LINE_AA)
        return img

    def __call__(self, img_path, save_path):
        # remove dir if exist
        if os.path.exists(save_path):
            shutil.rmtree(save_path)
        # make dir if not exist
        os.makedirs(save_path, exist_ok=True)

        # img process
        img = cv2.imread(img_path)
        img = letterbox(img)[0]
        img = cv2.cvtColor(img, cv2.COLOR_BGR2RGB)
        img = np.float32(img) / 255.0
        tensor = torch.from_numpy(np.transpose(img, axes=[2, 0, 1])).unsqueeze(0).to(self.device)

        # init ActivationsAndGradients
        grads = ActivationsAndGradients(self.model, self.target_layers, reshape_transform=None)

        # get ActivationsAndResult
        result = grads(tensor)
        activations = grads.activations[0].cpu().detach().numpy()

        # postprocess to yolo output
        post_result, pre_post_boxes, post_boxes = self.post_process(result[0])
        for i in trange(int(post_result.size(0) * self.ratio)):
            if float(post_result[i].max()) < self.conf_threshold:
                break

            self.model.zero_grad()
            # get max probability for this prediction
            if self.backward_type == 'class' or self.backward_type == 'all':
                score = post_result[i].max()
                score.backward(retain_graph=True)

            if self.backward_type == 'box' or self.backward_type == 'all':
                for j in range(4):
                    score = pre_post_boxes[i, j]
                    score.backward(retain_graph=True)

            # process heatmap
            if self.backward_type == 'class':
                gradients = grads.gradients[0]
            elif self.backward_type == 'box':
                gradients = grads.gradients[0] + grads.gradients[1] + grads.gradients[2] + grads.gradients[3]
            else:
                gradients = grads.gradients[0] + grads.gradients[1] + grads.gradients[2] + grads.gradients[3] + grads.gradients[4]
            b, k, u, v = gradients.size()
            weights = self.method.get_cam_weights(self.method, None, None, None, activations, gradients.detach().numpy())
            weights = weights.reshape((b, k, 1, 1))
            saliency_map = np.sum(weights * activations, axis=1)
            saliency_map = np.squeeze(np.maximum(saliency_map, 0))
            saliency_map = cv2.resize(saliency_map, (tensor.size(3), tensor.size(2)))
            saliency_map_min, saliency_map_max = saliency_map.min(), saliency_map.max()
            if (saliency_map_max - saliency_map_min) == 0:
                continue
            saliency_map = (saliency_map - saliency_map_min) / (saliency_map_max - saliency_map_min)

            # add heatmap and box to image
            cam_image = show_cam_on_image(img.copy(), saliency_map, use_rgb=True)
            cam_image = self.draw_detections(post_boxes[i], self.colors[int(post_result[i, :].argmax())], f'{self.model_names[int(post_result[i, :].argmax())]} {float(post_result[i].max()):.2f}', cam_image)
            cam_image = Image.fromarray(cam_image)
            cam_image.save(f'{save_path}/{i}.png')

def get_params():
    params = {
        'weight': 'yolov8n.pt',
        'cfg': 'ultralytics/cfg/models/v8/yolov8n.yaml',
        'device': 'cuda:0',
        'method': 'GradCAM', # GradCAMPlusPlus, GradCAM, XGradCAM
        'layer': 'model.model[9]',
        'backward_type': 'all', # class, box, all
        'conf_threshold': 0.6, # 0.6
        'ratio': 0.02 # 0.02-0.1
    }
    return params

if __name__ == '__main__':
    model = yolov8_heatmap(**get_params())
    model(r'ultralytics/assets/bus.jpg', 'result')